
[Analyze] is a tab where users can check the training results from [Train] and this shows the performance of training results for images labeled in [Database]. [Analyze] can be used to predict the performance when the training result are applied to actual experimental data.
[Analyze] consists of several sub-tabs, and each sub-tab is for inspecting or analyzing images using one training result. When training is completed in [Train], the screen automatically switches to [Analyze]. Sub-tabs are created according to the number of completed training items, and images from the validation group are imported to the image list by default.
If there exist already completed training results, it is also possible to add sub-tabs freely. When users add a sub tab and click the [  ] button, the Load Model window appears and users can select the desired training results. In this created sub-tab, the image labeled in [Database] can be loaded and inspected. Alternatively, users can add a sub-tab and click the [
 ] button to import a saved tab and perform the inspection.
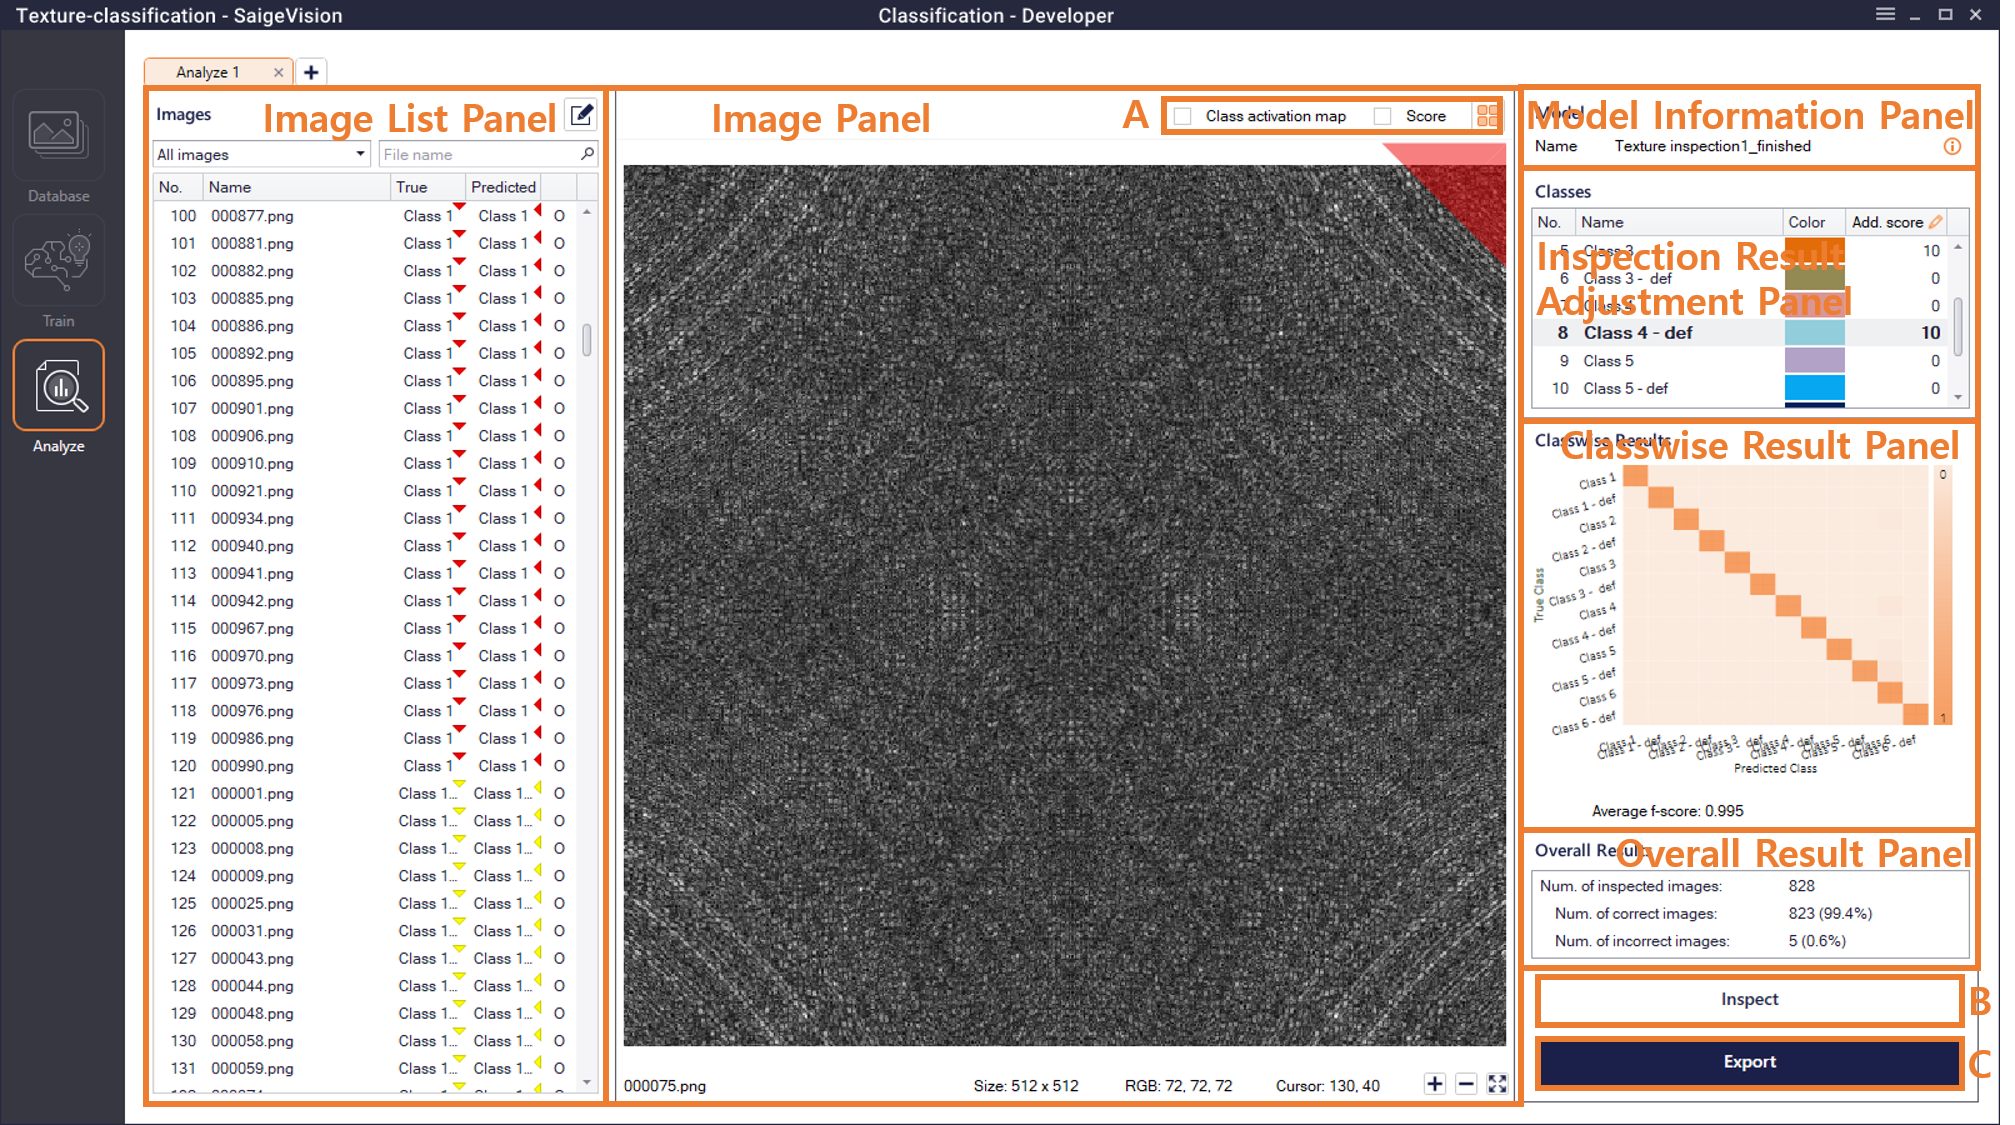
Image List Panel (Images)
This is a list showing images to be used for performance evaluation and shows 5 to 6 types of information such as image number and name according to the function as follows. Images can be sorted by each item.
Classification
- No.: Image number.
- Name: Image name.
- True: Defect class of the image labeled in [Database] (actual label).
- Predicted: Defect class of the image detected by the training result (detected label).
- O/X: O if True and Predicted match, otherwise X.
Detection and Segmentation
- No.: Image number.
- Name: Image name.
- True: The total number of labels drawn on the image (actual labels) in [Database].
- Detected: The total number of labels of the image detected by the training result (detected label).
- Underkill: The total number of labels that do not belong to the detected labels among the actual labels (total number of actual labels missed by the training results).
- Overkill: The total number of labels that do not belong to the actual labels among the detected labels (total number of labels incorrectly detected by the training result).
 : Click here to open the Edit Images window as shown below. Users can freely import images to inspect from the images labeled in [Database].
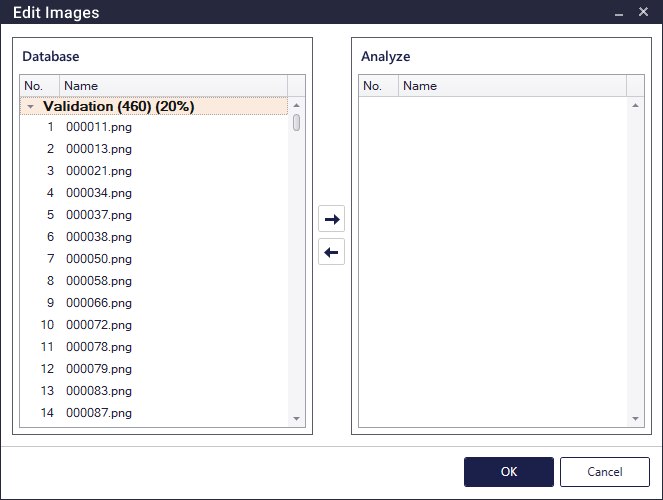
 : Click here to move the selected image from Database on the left to Analyze on the right.
 : Click here to move the image selected in Analyze on the right to Database on the left.
- When users clicks OK button, the images moved to Analyze on the right are loaded in the image list in the [Analyze] tab and users can inspect the images.
Image Panel
Classification
Score
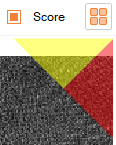
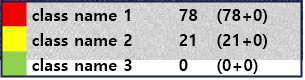
The image above shows the upper right and lower right of the image panel. The upper area of the triangle in the upper right part represents the color of the actual defect class, and the lower area indicates the color of the detected defect class. If the colors of the two triangles match, the classification has been successful; otherwise, classification has failed. When the checkbox next to Score is checked, the score box for the defect classes appears at the bottom right of the Image panel as shown in the right part of the image above. The color, name, and inspection score of the defect class appear here. The high inspection score of the defect class means that the trained model has a high tendency to classify the inspection image into the corresponding class, and the image is classified as the defect class with the highest score.
Inspection scores are calculated through equations in parentheses. The first value in parentheses is the inspection score detected by the actual model, and the second is the inspection result adjustment parameter. The values of the inspection result adjustment parameter can be adjusted through Add. Score in the Inspection Result Adjustment panel.
Class Activation Map
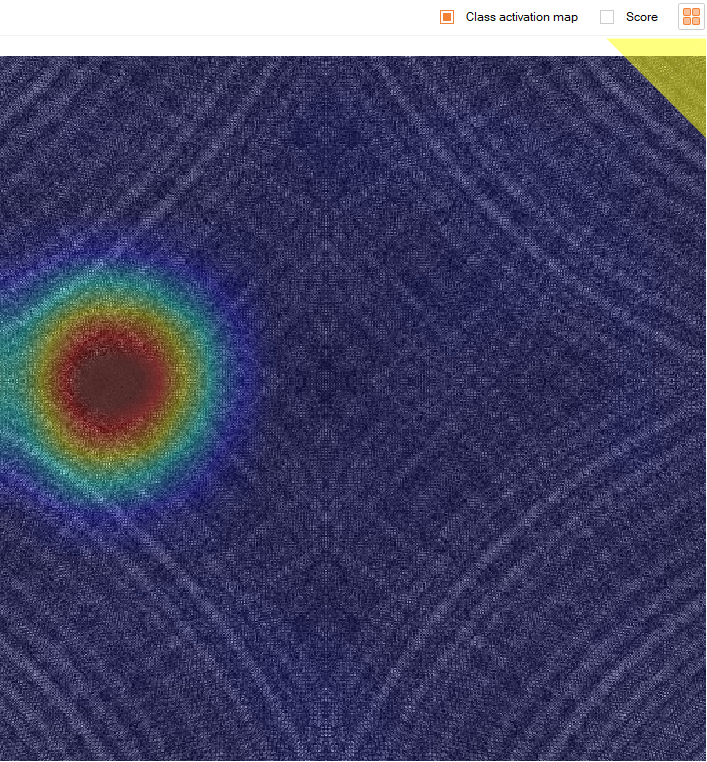
The Classification mode provides a Class Activation Map function for the inspection results
when  on the top of the Image panel is checked. This function shows
what part of each image was intensively trained by the trained network model.
Thumbnail View
In the Classification mode, clicking the Switch button (  ) at the top of the Image panel will switch the Image panel to the Thumbnail View panel.
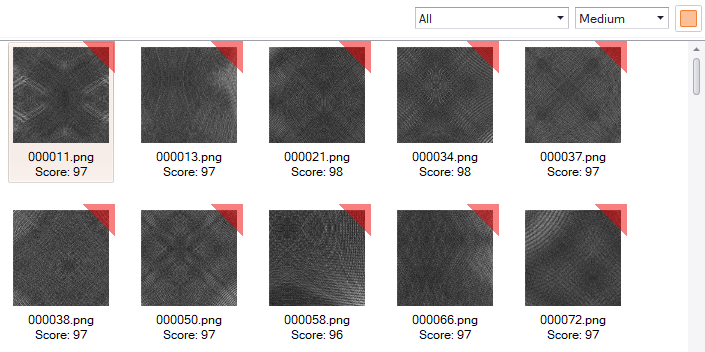
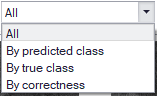 : These are the criteria for sorting the images in the Thumbnail View panel.
- All: This shows a complete list of images.
- By predicted class: This shows the image sorted by the detected class.
- By true class: This shows images sorted by actual class.
- By correctness: This shows the images sorted by whether it is correctly classified or not.
 : Users can select the displayed size of the images in the Thumbnail View panel. This can also be controlled using Ctrl + mouse wheel down / up.
Detection

The image above shows the top right part of the Image panel. The Image panel in the Detection mode shows the actual label (True), detected label (Detected), and deleted label (Removed) of the selected image along with the image. The colors of the actual label and the detected label follow the class colors of the corresponding labels, and the deleted label is shown in gray. Whether the checkboxes are checked or not determines the presence or absence of labels on the Image panel.
- True: Whether to show the actual labels of the image (The true label drawn by users in [Database]).
- Detected: Whether to show, among the labels detected by the trained model, the labels finally detected by satisfying the conditions of Score Threshold and Area Threshold.
- Removed: Whether to show the labels detected by the trained model but deleted due to not satisfying the condition of Score Threshold or Area Threshold.
Segmentation

The image above shows the top right part of the Image panel. The Image panel in Segmentation mode shows the actual label of the selected image (True) and the detected label (Detected) along with the image. The color of the displayed label is the color of the corresponding class. Whether the checkboxes are checked or not determines the presence or absence of labels on the Image panel.
- True: The actual label of the image (The true label drawn by users in [Database]).
- Detected: A label detected by the trained model.
Model Information Panel (Model)
The Model Information panel displays the name of the training result set in the [Analyze] tab. When users click the Information button [  ], detailed information of the relevant training results appears.
Inspection Result Adjustment Panel (Overall Threshold)
In the Inspection Adjustment Result panel, users can adjust in detail the inspection results by making appropriate changes to the result values detected by the trained model for the image. This includes changing of Underkill / Overkill ratio, etc.
Classification
The inspection result adjustment parameter in the Classification mode is Add. score ((Additional score). With Add. score, each defect class can be adjusted independently. After the inspection of the image, for the trained model, the score value of each class is shown to indicate how well the inspection image matches each defect class. The value of Add. score is added to this. Finally the defect class with highest value after summing the score of the model and Add. score is determined as the defect class of the image.
Detection
Inspection result adjustment parameters in the Detection mode include Score TH (Threshold) and Area TH (Threshold). Both parameters can be adjusted independently for each defect class, and the default values of Score TH and Area TH are 50 and 0, respectively.
The defect label detected by the trained model contains the score, and information about the defect class to which the defect label belongs. At this time, the labels are treated as Detected Label only when the score of each label exceeds the Score TH value of the class; otherwise, they are treated as Removed Label. Therefore, the criteria of the detection score of the corresponding class can be adjusted by controlling the Score TH value. The range of Score TH value is [0-100].
Area TH represents the reference value of the size of the defect label region detected (number of pixels). Among the detected labels, those that exceed the value of Area TH of the class are classified as Detected Labels; otherwise, they are classified as Removed Label. The Area TH value ranges from 0 to the number of pixels of the largest label among the boxes detected by the corresponding class.
Segmentation
The inspection result adjustment parameters in the Segmentation mode include Score TH (Threshold) and Area TH (Threshold). Both parameters can be adjusted independently for each defect class, and the default values of Score TH and Area TH are 100 and 0, respectively.
The default value of Score Threshold is 100 and the adjustment range is from 0 to 255. Each pixel has scores for all classes. First, it should be checked whether the corresponding score of each class exceeds the Score Threshold or not, and then, set the class with the highest score among the classes exceeding the Score Threshold as the class of the corresponding pixel.
Example
The Score THs for each class are as follows: 40 for class 1, 50 for class 2, and 5 for class 3. After inspection, a specific pixel (x = 200, y = 100) gets scores of 30 for class 1, 40 for class 2, and 10 for class 3. Here, the only class that exceeds their Score TH among the three classes is class 3. In this case, the pixel is classified as class 3.
Area TH in the Segmentation mode is the same as Area TH in the Detection mode.
Classwise Result Panel (Classwise Results)
The Classwise Result panel displays the inspection results for each class in graphs or tables.
Classification
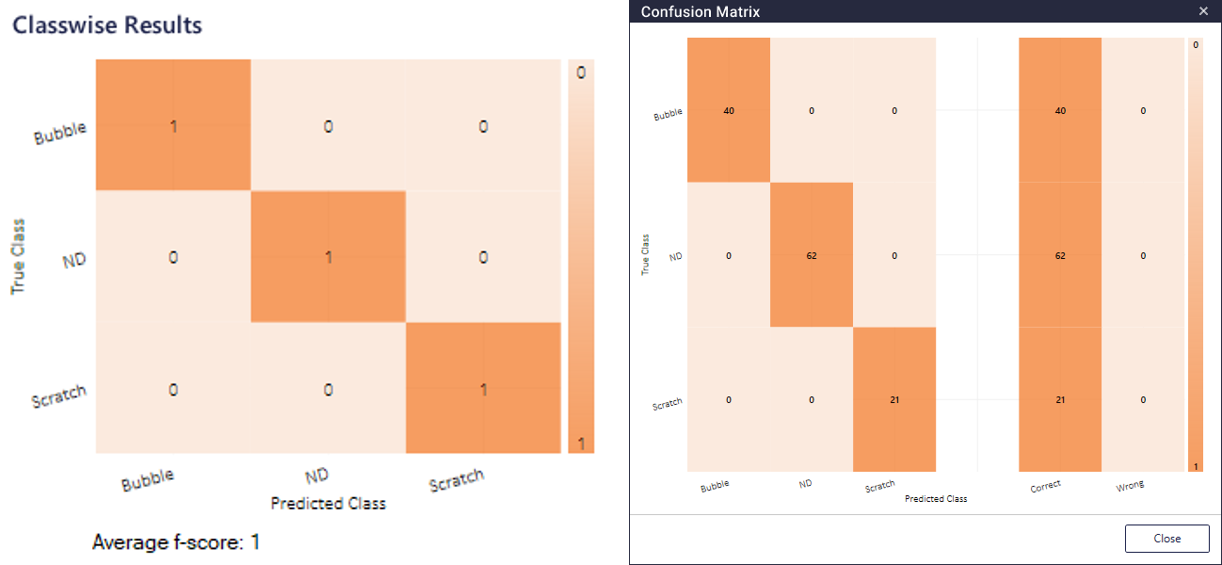
The image on the left is an example of the Classwise Result panel in the Classification mode and is called the Confusion Matrix. Confusion Matrix shows, in a table, what classes the images of the defect class were classified for each class as a result of inspection. The y-axis of the Confusion Matrix represents the defect class labeled by users (True Class) in [Database], and the x-axis represents the defect class detected by the trained model (Predicted Class). The value in the Confusion Matrix is the ratio of the number of images classified as Predicted Class to the number of images belonging to the True Class of the cell. Therefore, the closer the cell values above the diagonal line from the top left to the bottom right of the Confusion Matrix are to 100%, the more accurate the model is. The closer the values are to 1, the closer the colors of the cells are to dark orange. The average f-score value at the bottom shows the average value of f-score values of each class (This is a harmonic mean of precision and recall values, which means accuracy in the Classification mode).
When users click on the Confusion Matrix, a window appears showing the Confusion Matrix and a simplified table as shown on the right. The table that appears on the right side of the window shares the y-axis of the Confusion Matrix, and the x-axis includes Correct section and Wrong section. The values above the diagonal line from the top left to the bottom right of the Confusion Matrix appear in the Correct section, and other cells are called wrong cells, and the values added for each y-axis (True Class) appear in Wrong section.
All inspection result information changes in real time in conjunction with the Inspection Result Adjustment panel.
Detection and Segmentation
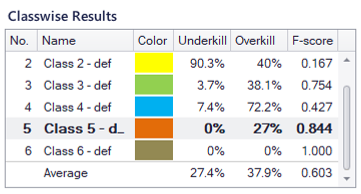
Users can check the Underkill ratio, Overkill ratio, and F-score value for each class in the Result panel of the Detection mode, and the average value is shown in the bottom row. The Result panel in the Segmentation mode is similar to the Detection mode, with the difference that there is an IOU column instead of the F-score column.
Overall Result Panel (Overall Results)
The Overall Result panel shows the inspection results in graphs and text.
Classification
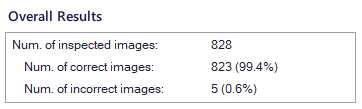
The Overall Results panel in the Classification mode displays the number of inspected images and the number and ratio of images that were correctly classified by the trained model (correct images) among the inspected images, and the number and ratio of images that were not correctly classified by the trained model (incorrect images) among the inspected images.
Detection and Segmentation
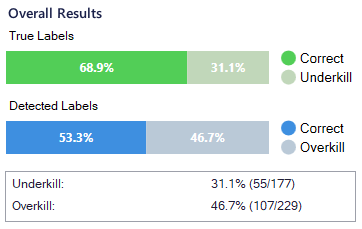
The Overall Results panel in the Detection and Segmentation modes displays information about underkill and overkill for all labels of the tab in text and bar graph.
Inspect
When users click the [Inspect] button, the Inspect Progress window appears. Users can inspect the uninspected images among the images loaded in the Image List panel and check out the progress information.
Segmentation
Segmentation mode has an option to specify max inspection size when inspecting. If the size of the image to be inspected is larger than the maximum inspection size, image is resized to the maximum inspection size with the same aspect ratio before the inspection is performed.
Example
If the max inspection size is 1000 x 2000 and the size of the image to be inspected is 1200 x 1800, the target image is resized to 1000 x 1500 in inspection phase.
Export
When users click the [Export] button, the analysis results are reported as follows for each mode.
Classification
- Text file: This file provides total results including parameter information, confusion matrix and numerical values such as statistics for each class.
- Copy Classified Images:
- All inspected results as images: This creates a folder structure according to the actual classification information and the classified results, and copies and saves all images used for analysis.
- Sorted by correctness of the classification: This creates a folder structure by grouping correctly classified images and wrongly classified images and saving them separately.
- Users can select whether to export the class activation map result when saving as an image. A new folder is created by adding "_Visualize" to the end of the folder name.
Detection
- Text file: This file allows users to check the set parameter information, the total Underkill and Overkill values, and the Underkill, Overkill and f-score values for each class.
- Overlayed Iamges:
Sorted by with or without 'Detected' objects: It separates images in which one or more objects are detected from images in which none are detected, and saves them separately by creating folder structures.
Sorted by with or without 'Underkilled' objects: It separates images including one or more Underkills from images not including Underkill, and saves them separately by creating folder structures. Here, images labeled as OK images are not exported.
Sorted by with or without 'Overkilled' objects: It separates images including one or more Overkills from images not including Overkill, and saves them separately by creating folder structures.
Segmentation
- Text file: This file allows users to check the set parameter information, the total Underkill and Overkill values, and the Underkill, Overkill and IOU values for each class.
- Overlayed Images:
- Sorted by with or without 'Detected' objects: It separates images in which one or more objects are detected from images in which none are detected, and saves them separately by creating folder structures.
- Sorted by with or without 'Underkilled' objects: It separates images including one or more Underkills from images not including Underkill, and saves them separately by creating folder structures. Here, images labeled as OK images are not exported.
- Sorted by with or without 'Overkilled' objects: It separates images including one or more Overkills from images not including Overkill, and saves them separately by creating folder structures.
- Raw Data: A sub-folder with the class name for each class is created and the detection result of each pixel class is provided in the form of a heat map ranging from 0 to 255 for all inspected images.
- Cropped Patches: A sub-folder is created with the class name for each class. The image is saved in the sub-folder for each class after being cropped out including the detected object. The saved patch image can be used in many ways, such as post-processing using the Classification mode.
- Export OK patches: This crops and saves the OK patch image in areas that do not overlap the detected object. Users can specify the number of OK patch images to save in the text box, and the total number of detected objects is entered by default value.
- Crop size: This specifies the size of the patch image.
- Large objects exceeding 'Crop size': This specifies how to handle if the size of the detected object is larger than the size of the patch image.
- Crop by object's size, and resize to 'Crop size': It crops the detected object in a square having a side of the length of the longest side of the rectangle containing the detected object plus the extra lengths of the top and bottom and left and right sides at a margin ratio, and then resizes to the specified patch image size.
Example) When cropping an object detected with a size of 100 x 200 at a rate of 10% of the margin, crop to a size of 240 x 240 (= 200 x (1 + 2 x 10%)) and then resize it. - Crop by object's size: It crops the detected object in a square having a side of the length of the longest side of the rectangle containing the detected object plus the extra lengths of the top and bottom and left and right sides at a margin ratio.
Example) When cropping an object detected with a size of 100 x 200 at a rate of 10% of the margin, crop to a size of 240 x 240 (= 200 x (1 + 2 x 10%)). - Crop center by 'Crop size': It crops into squares with a specified patch image size based on the center of the detected object.
- Crop by object's size, and resize to 'Crop size': It crops the detected object in a square having a side of the length of the longest side of the rectangle containing the detected object plus the extra lengths of the top and bottom and left and right sides at a margin ratio, and then resizes to the specified patch image size.
- Image format: This specifies the image format of the patch to crop and save among * .png, * .jpeg, and * .bmp. For the generated image (* .srImage) being exported, it is saved in * .srImage format, not the specified image format.
Save or Load Tabs
Users can save the tab which completed the inspection as a file in .srAnalyzeTab format by right-clicking the tab (  ) or clicking the Save Current Tab button in the top right menu. Saved tabs can be loaded by clicking the Add Tab button (
 ) in [Analyze], and then clicking the Load Tab button ( ).